
Referenced in:





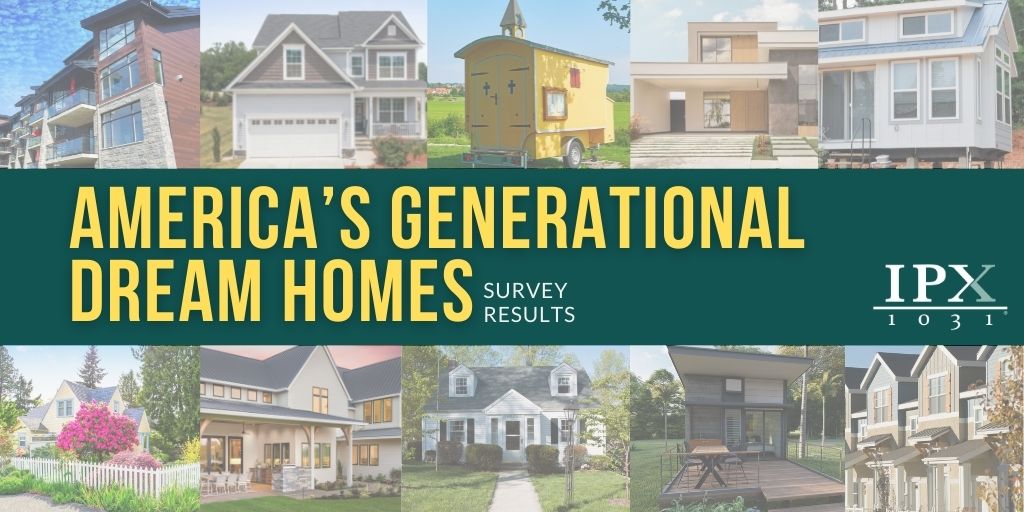
If you close your eyes and imagine your dream home, where would it be? On the beach or in the city? What would it look like? Maybe you prefer new construction while others would like a cozy renovation project.
Here at IPX1031, we surveyed more than 1,000 Americans among the four generations to learn about their home buying habits and what their ideal homes, including vacation properties, look like.
Many may say there are major differences among Generation Z, Millennials, Generation X, and Baby Boomers, however, we’ve found there are several commonalities.
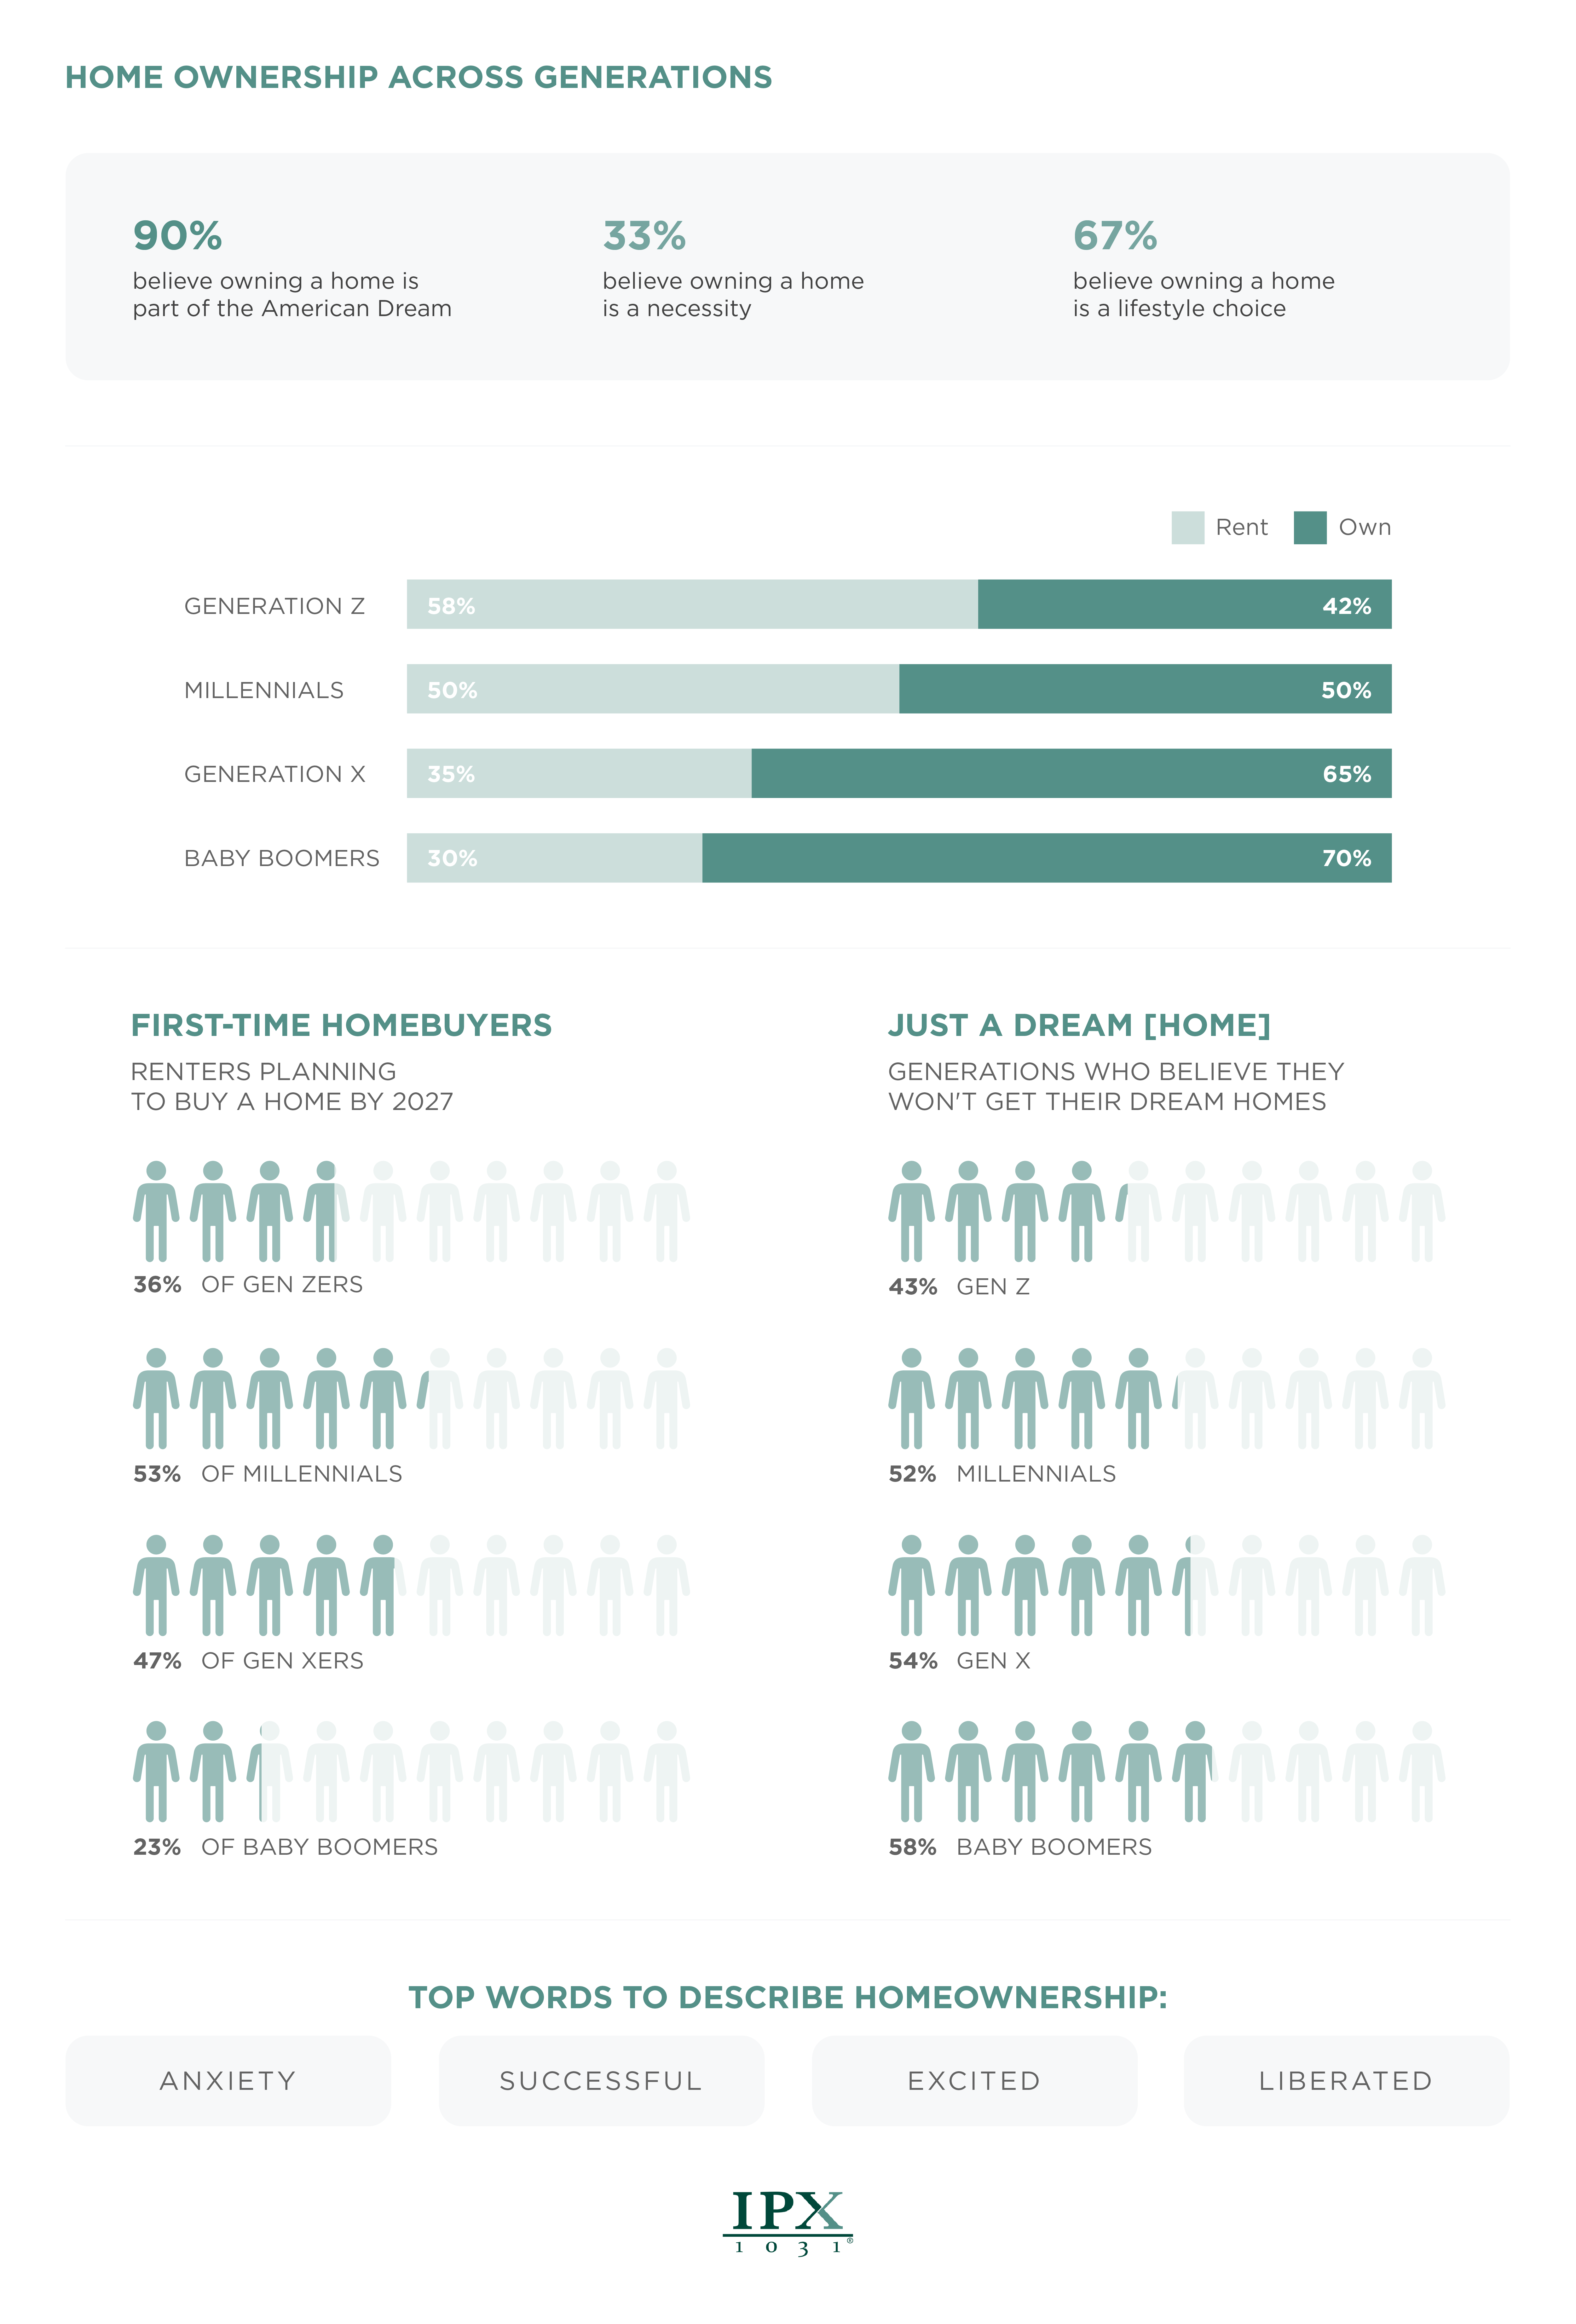
Overall, 90% of those surveyed believe owning a home is part of the American dream. Despite this belief, only 33% believe owning a home is a necessity. The other 67% say it is a lifestyle choice.
When looking at generational differences, it may be no surprise the majority of Baby Boomers (70%) and Gen X (65%) currently own homes. As people get younger in age, fewer own homes with half (50%) of Millennials and 42% of Gen Z saying they currently own a home. Many are looking to the future, and planning to buy a home by 2027. More than 1 in 3 (36%) of Gen Z plan to buy, followed by 53% of Millennials, 47% of Gen X, and 23% of Baby Boomers.
For some, owning their ideal home may be just a dream. 43% of Gen Z, 52% of Millennials, 54% of Gen X, and 58% of Baby Boomers believe they won’t ever own their dream home.
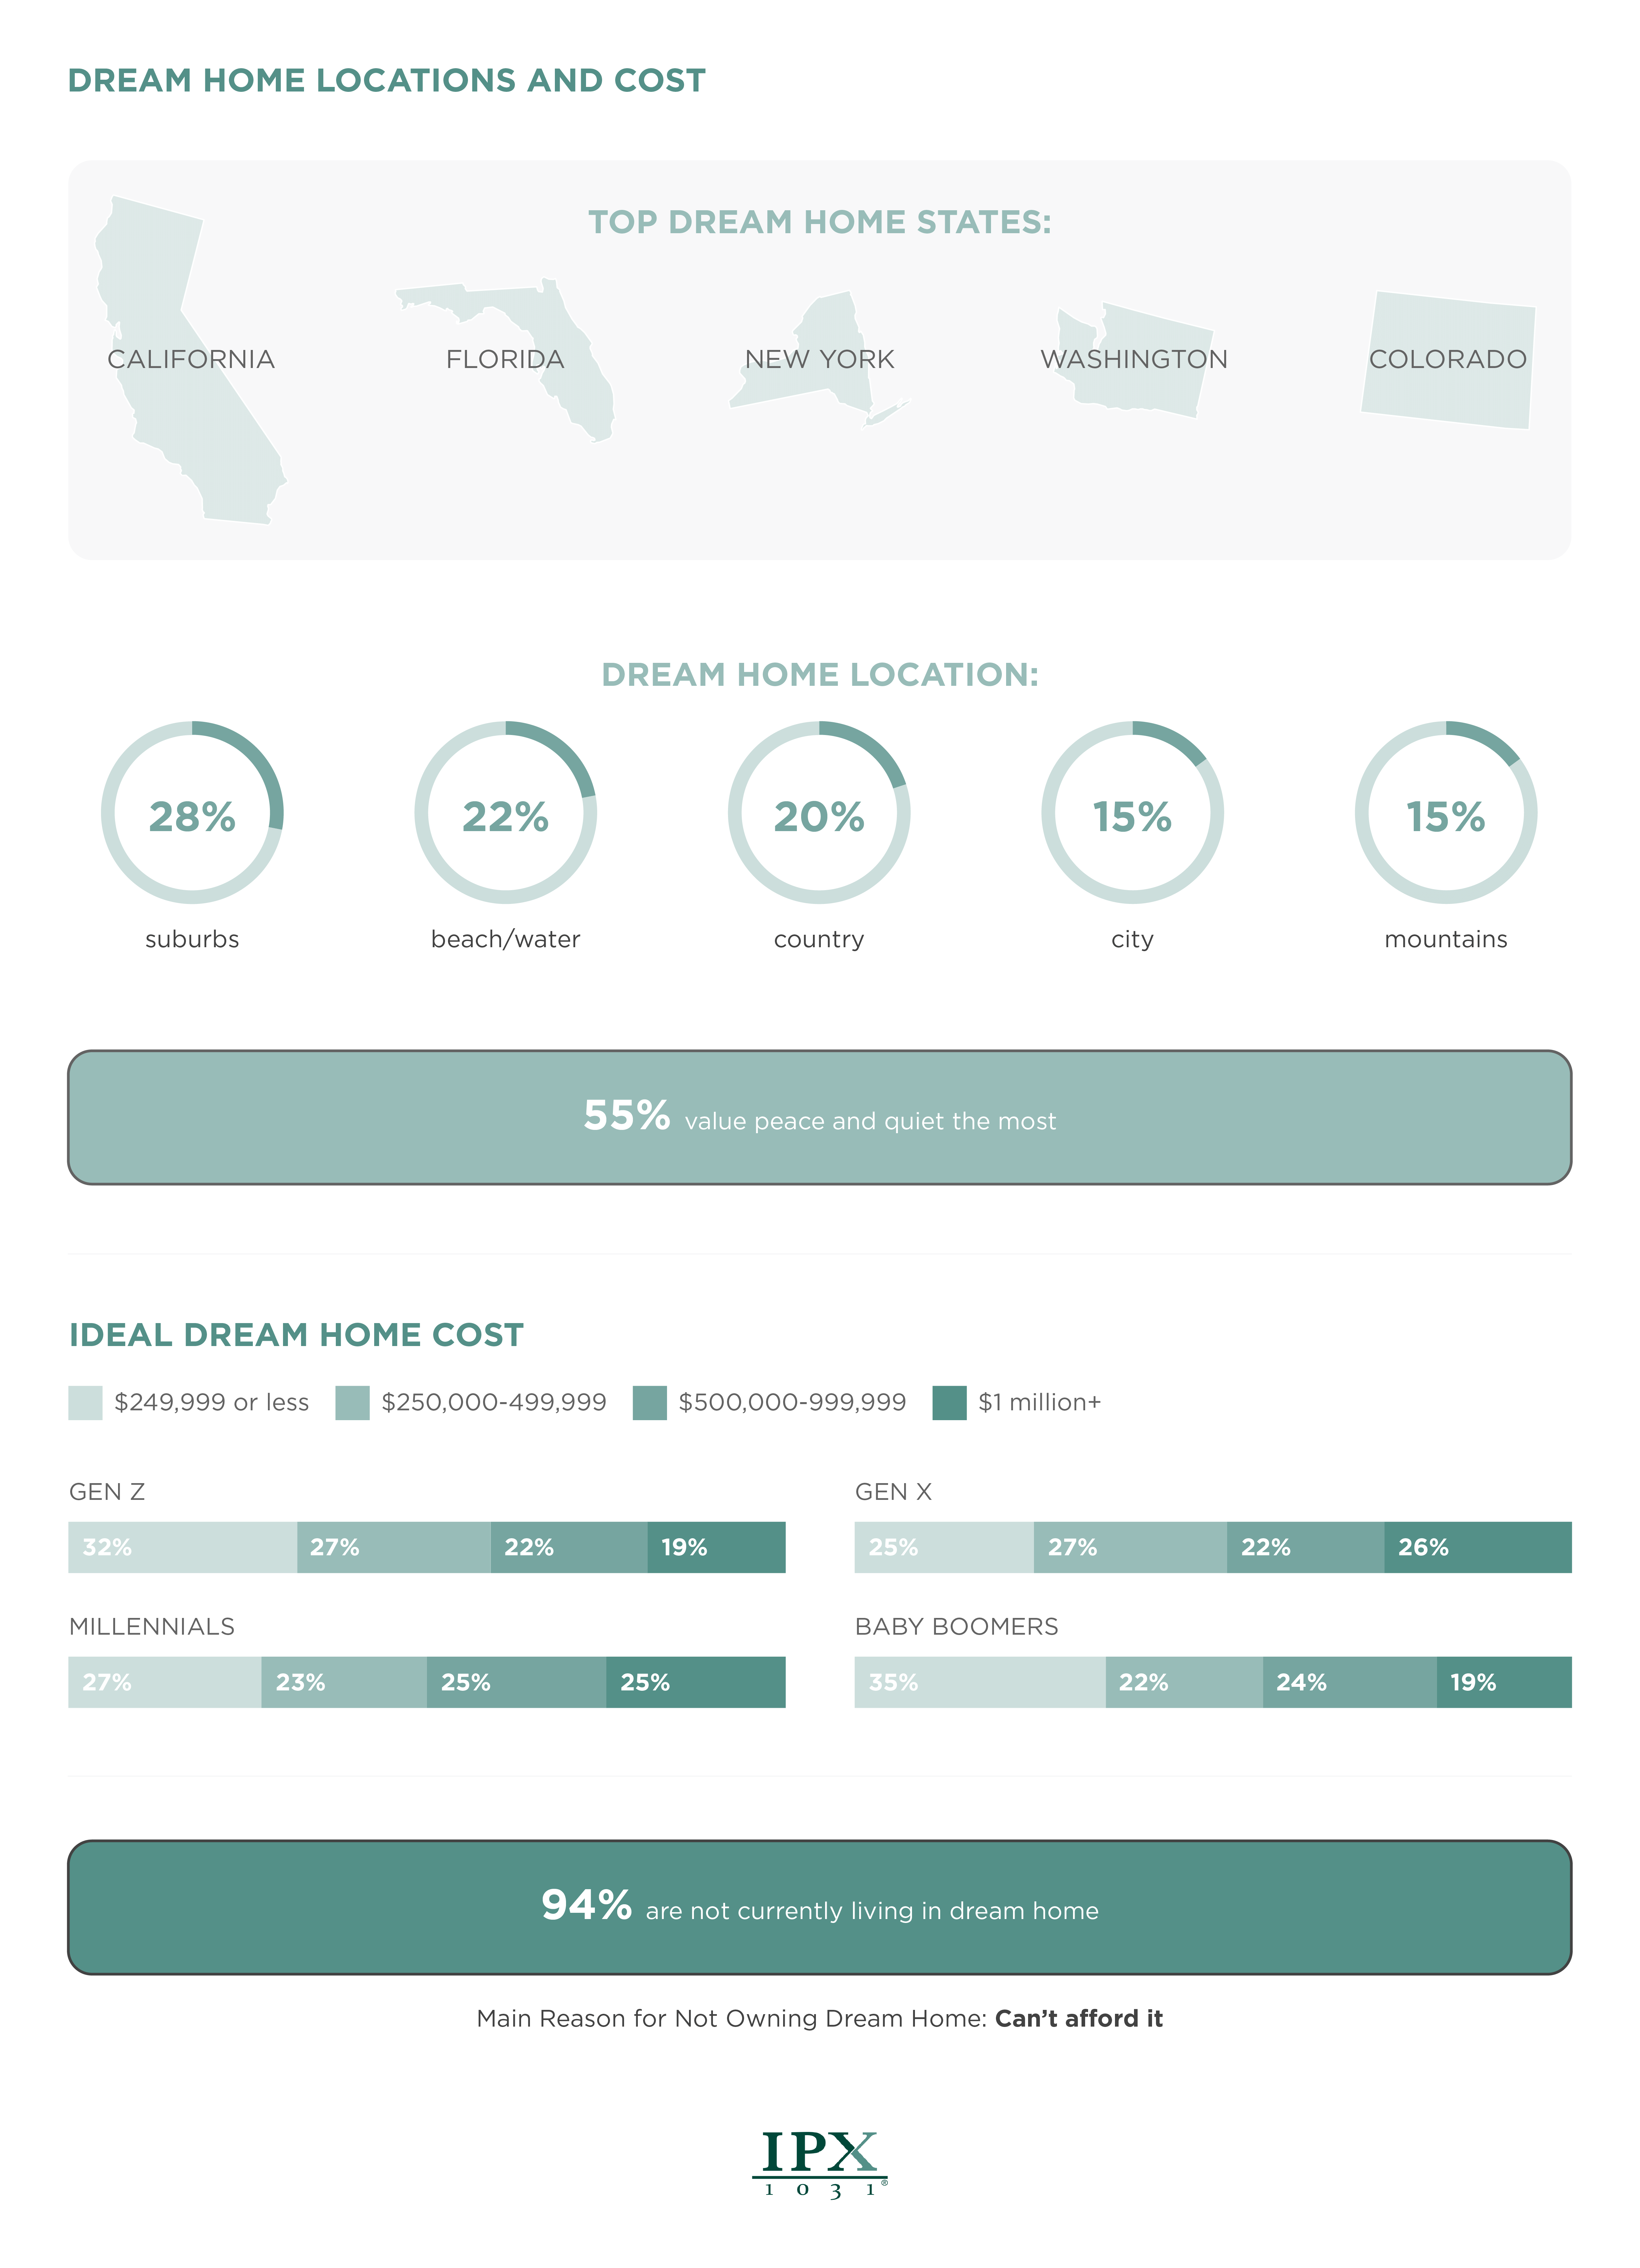
When it comes to where people would like their ideal dream home to be, California, Florida, New York, Washington, and Colorado top the list. As for the location and surroundings, 28% would like their dream home in the suburbs, 22% on the beach or water, and 20% in the country.
As for cost, the majority of Gen Z, Gen X, and Baby Boomers say their dream home price tag would be $499,999 or less. Among Millennials, 50% say the ideal asking price would be $499,999 or less.
Despite having varying views of dream homes, 94% of Americans say they are not currently living in their dream home, with the top reason being they cannot afford it.
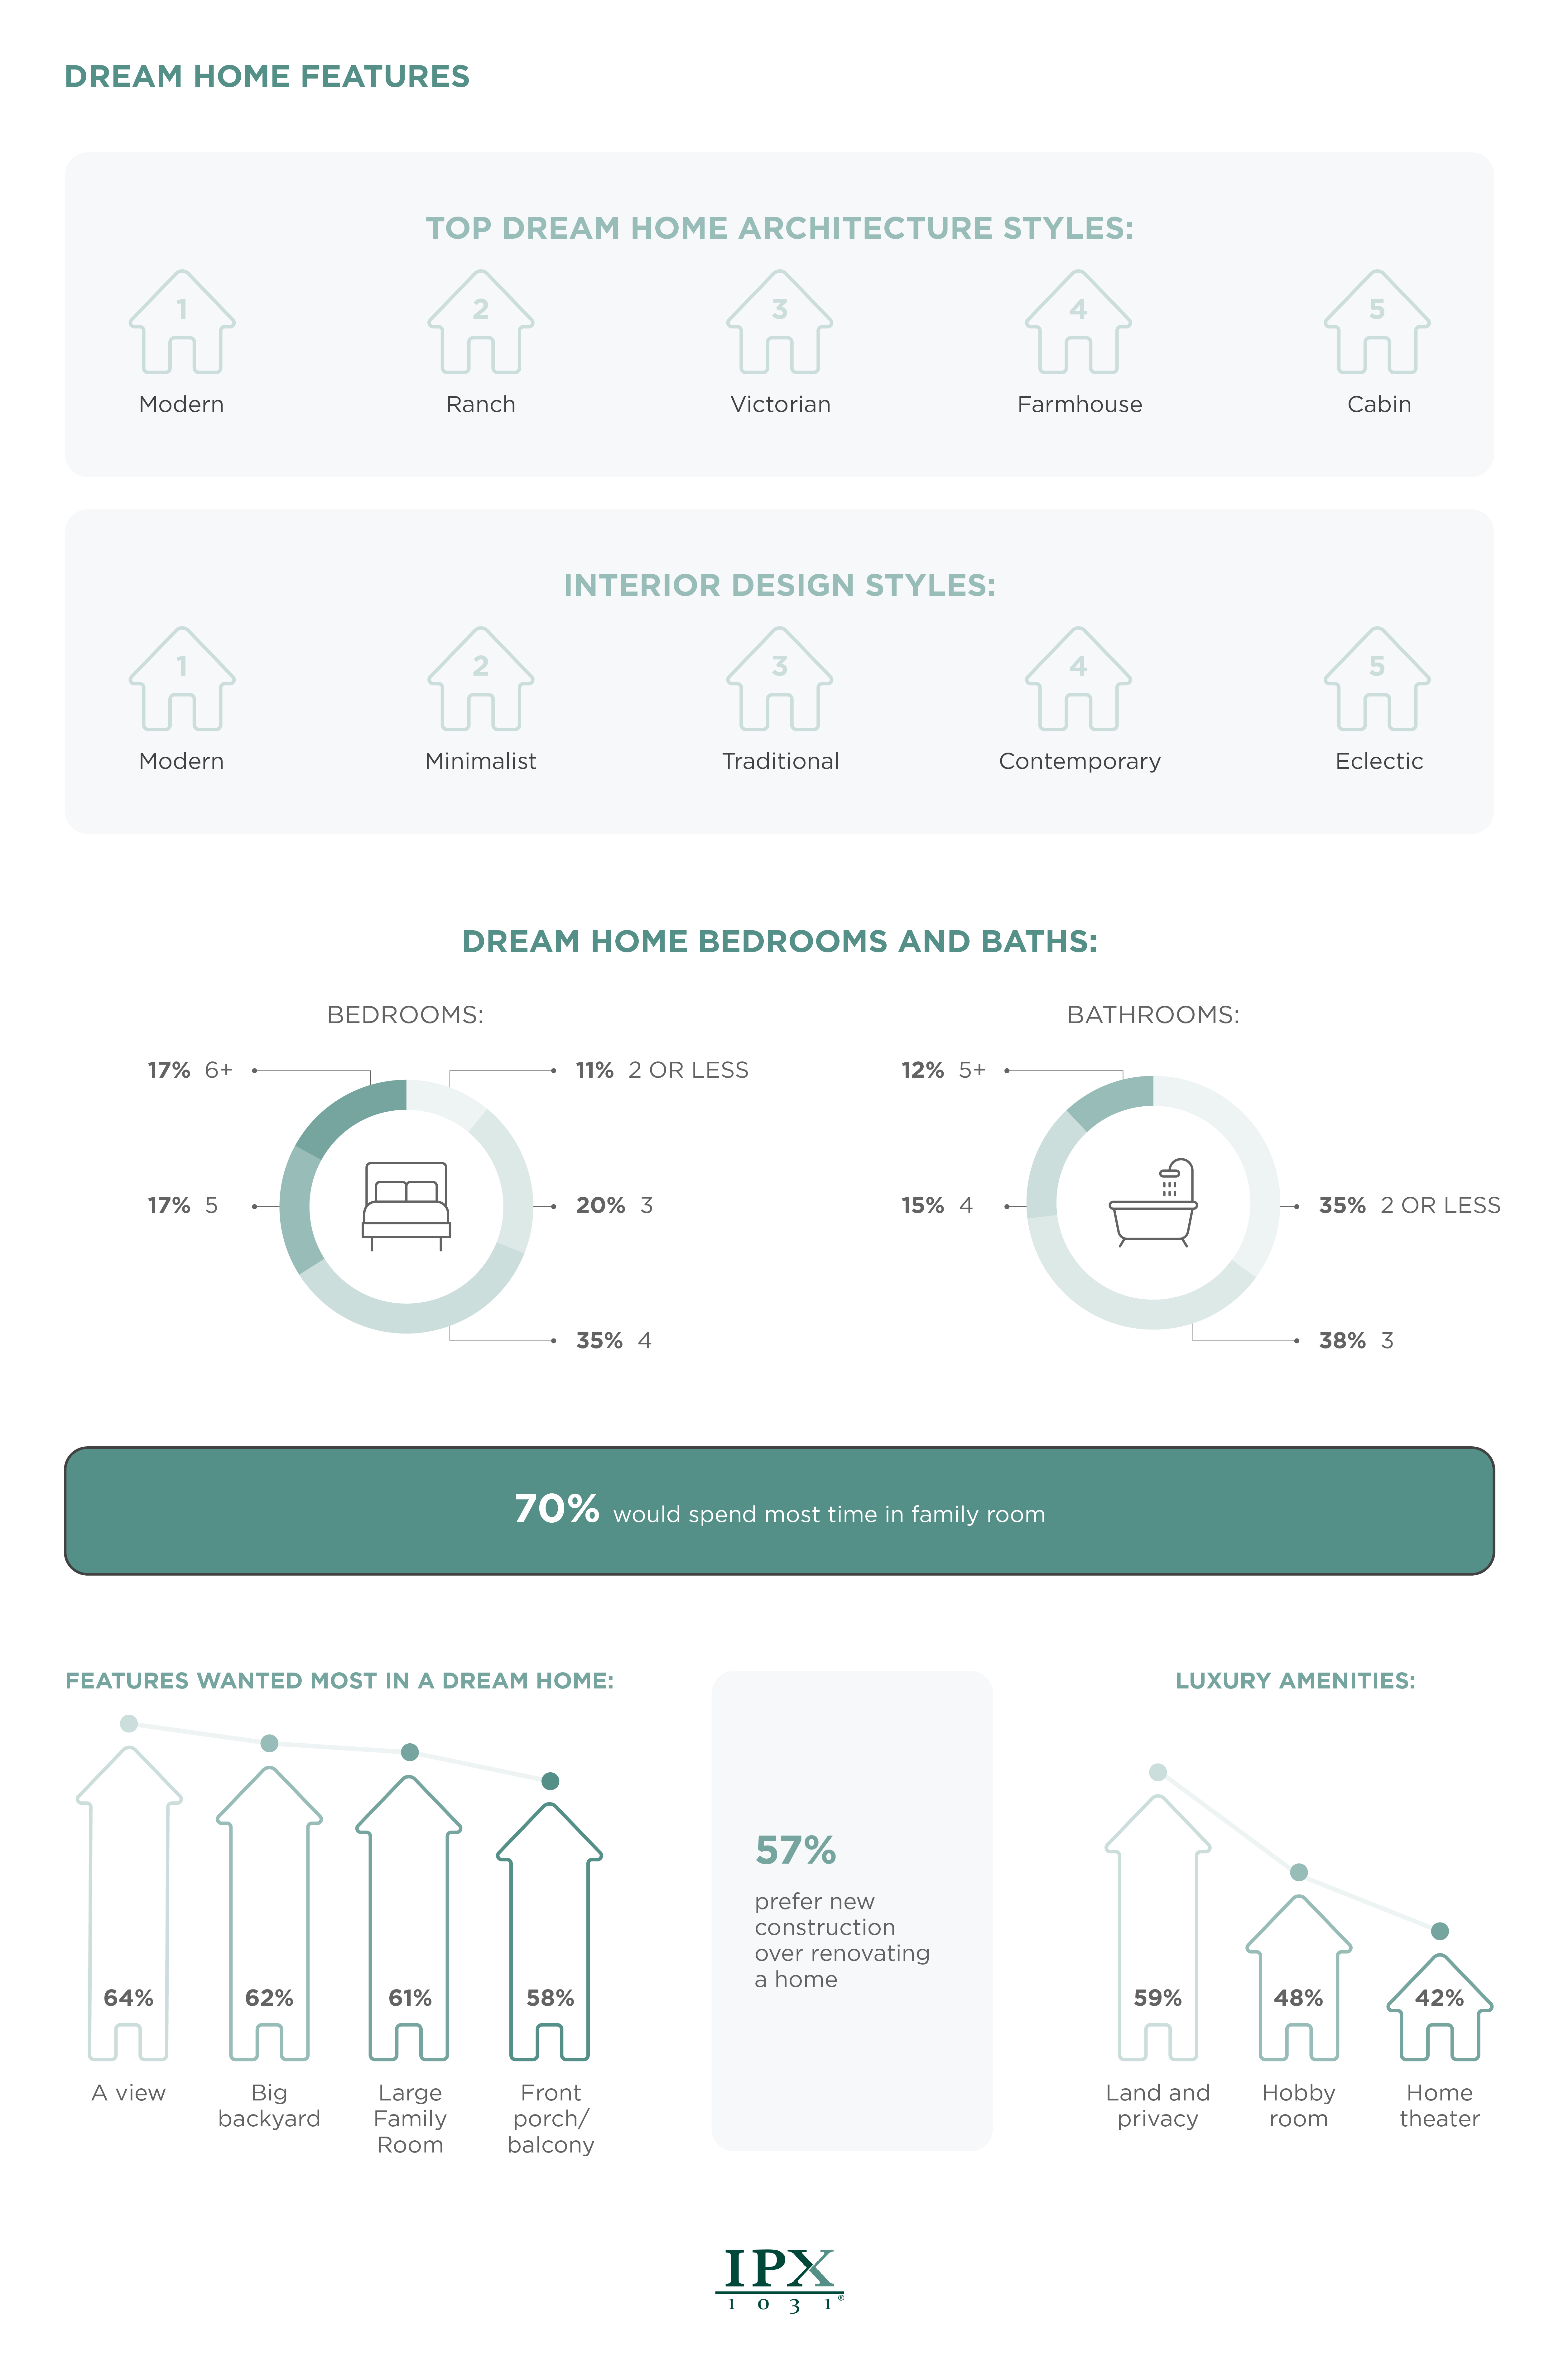
The top architecture styles for Americans’ dream homes are modern, ranch, Victorian, farmhouse, and cabin. Inside the home, people prefer modern designs, followed by minimalist, traditional, contemporary, and eclectic. Additionally, 57% prefer new construction over renovating a home.
35% of people would like their dream home to have four bedrooms and 20% would prefer three bedrooms. When it comes to bathrooms, 38% would prefer 3 bathrooms in their home and 35% would like 2 or less.
For many, a dream home isn’t just about the layout, but the features. 64% want a dream home with a view, 62% desire a big backyard, 61% want a large family room, and 58% would like a front porch or balcony. It may be no surprise that 70% of people say they would spend the most time in their family room.
The top luxury amenities people are looking for in a home are land and privacy (59%), a hobby room (48%), and a home theater (42%).
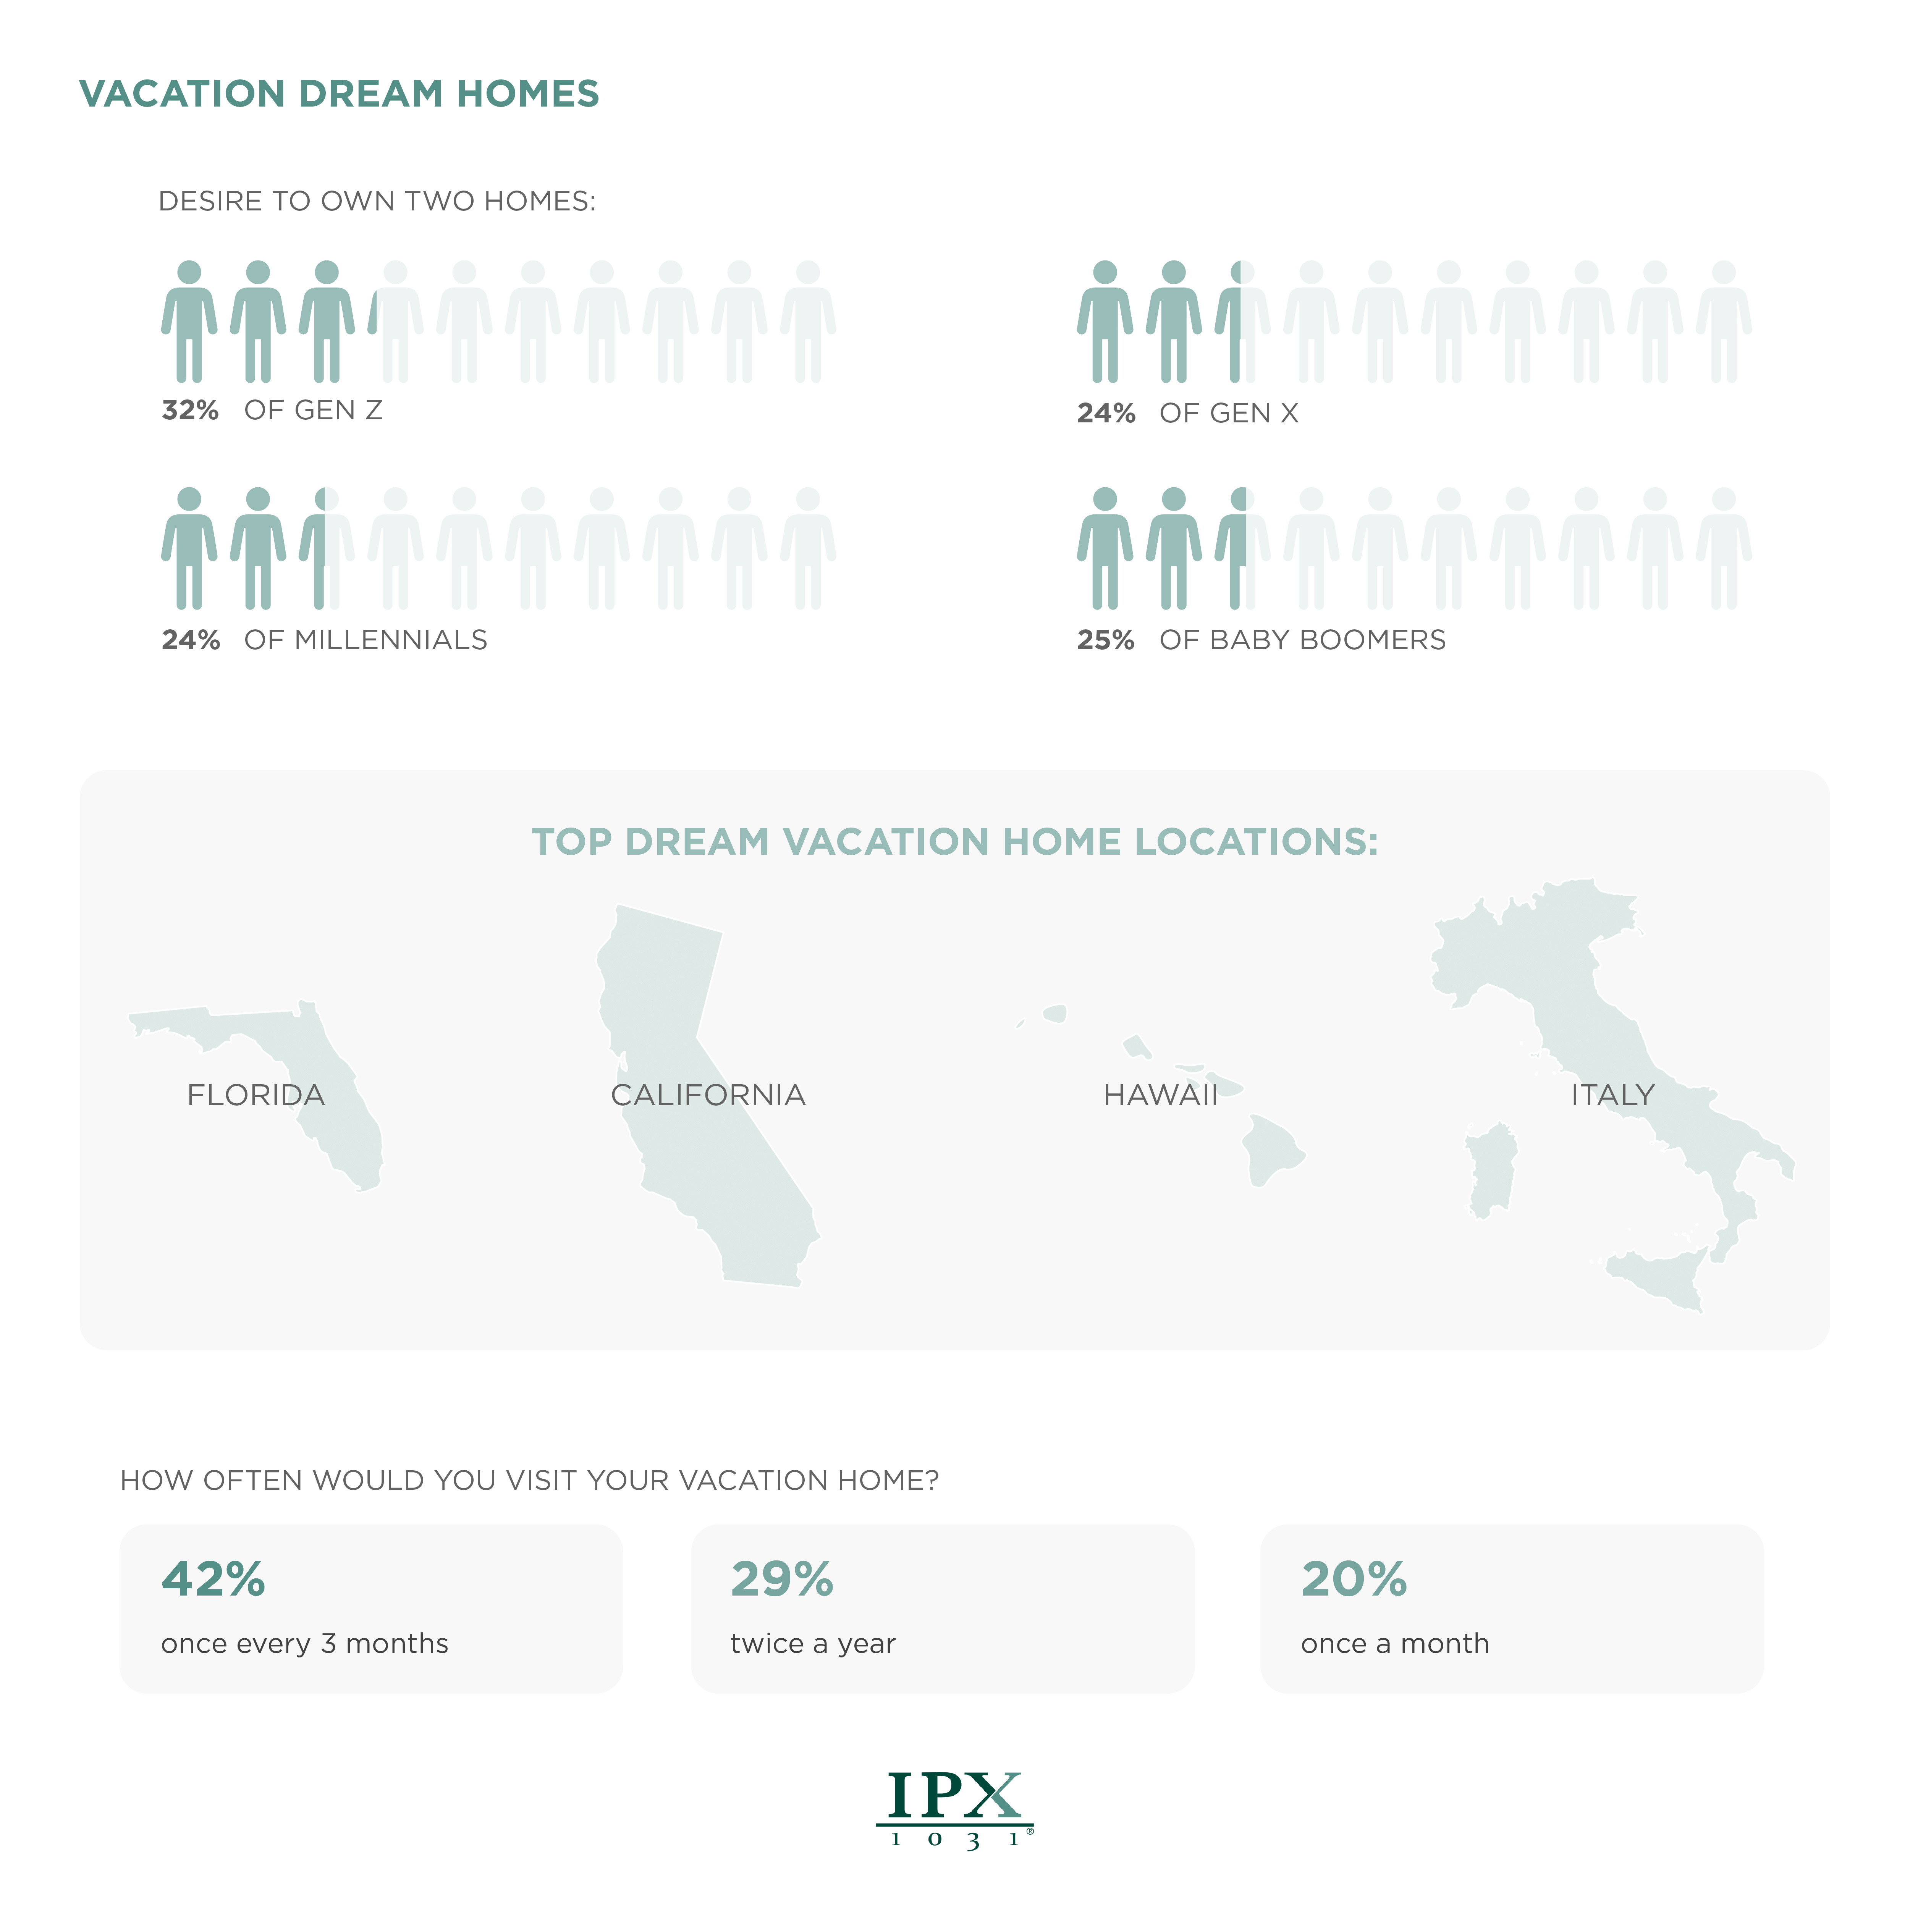
When it comes to dream homes, for some people, that involves owning a vacation home. In fact, 32% of Gen Z, 24% of Millennials and Gen X, and 25% of Baby Boomers desire to own two homes.
Your dream vacation home may be on the beach, in the countryside, or in another country altogether. Among Americans, the top dream vacation home locations are Florida, California, Hawaii, and Italy. As for how often they would visit this vacation home? 42% said every three months, followed by 29% who would visit once a year, and 20% who would spend time at their ideal vacation home once a month.
If you have a dream home or are planning on buying a future dream home, click here to learn more about how a 1031 Exchange can help preserve your assets when selling and buying investment properties. Then read How to Buy Your Dream Home with a 1031 Exchange to learn more about how to strategically purchase a future dream, vacation, or retirement home with 1031 proceeds. You can find more information here about IPX1031, the nation’s largest 1031 Exchange intermediary.
Methodology
In September 2022, we conducted a survey of 1,062 people from around the U.S. across four generations, Gen Z (aged 18-25), Millennials (aged 26-41), Gen X (aged 42-57), and Baby Boomers (aged 58-70). Among respondents, 49% identified as male, 48% as female, and 3% as non-binary or transgender.
For media inquiries, contact media@digitalthirdcoast.net
Read more:
How to Buy Your Dream Home with a 1031 Exchange
Vacations Spurring Investment 1031 Exchanges
Opportunities of the 1031 Exchange
Do Vacation and Second Homes Qualify?
How to Maximize 1031 Via Your Home Office
2 Is Better Than 1: A 1031 Win with Dual Use Property